

Building Reliable LLM Batch Processing Systems
A practical fan-out architecture for long-running workloads


Today, we have a guest article from the one and only Alexandru Vesa, an ML / AI Engineer, Founder, and the creator of the Hyperplane publication.
Alex spends his time deep in the trenches of real-world AI Systems, where things don't fail in theory … they fail at 3 AM with no logs and half the data gone!
In this article, he walks us how to build reliable LLM batch processing systems, grounded in a real production use case.
Enjoy!
Miguel
🙋 Before building any distributed system, take one minute to ask yourself: what happens when it breaks?
If you're processing batch workloads with LLMs, you've probably hit this wall:
Document processing: 500 contracts to analyze, each taking 20 seconds. Lambda times out at contract 45.
Data enrichment: 200 company profiles to research, each requiring 3 API calls. Job dies at 14:58.
Report generation: 80 monthly reports, each needing LLM summarization. Half complete, half lost.
Image pipelines: 300 product photos to caption. Progress bar stops at 23%.
The pattern is always the same: your workload works for 10 items. Then a customer sends 100 items, and everything breaks.
👉 I've been there. Many times.
This article shows how we fixed it for one client, a sales intelligence platform analyzing 127 deals. But the pattern applies to any GenAI batch workload where:
Each item is independent (item A doesn't need item B's result)
Each item takes significant time (5-60 seconds via LLM)
The total workload exceeds Lambda’s 15-minute limit
If that describes your system, keep reading!

Case Study - Sales Deal Intelligence Extraction
Before I show you any architecture, let me describe what we're dealing with.
The client's system analyzes sales deals to extract intelligence signals:
Qualification assessment: BANT criteria (Budget, Authority, Need, Timeline) scored 0-100
Risk signals: Single-threaded deals, gone silent, competitor mentions, budget concerns
Buying signals: Pricing discussions, demo requests, decision maker engagement
Pain points: Specific problems the buyer is trying to solve
Engagement quality: Response patterns, champion strength, decision maker involvement
Here's what makes this domain challenging:
Each deal is independent - Deal A's analysis doesn't depend on Deal B's. Perfect for parallelization.
LLM calls are slow - 25 / 35 seconds per deal. Sequential processing stacks wait times.
Large pipelines - The client's pipeline had 127 deals. More pipelines had 200+.
Timeout constraints - Lambda’s 15-minute limit becomes a hard ceiling.
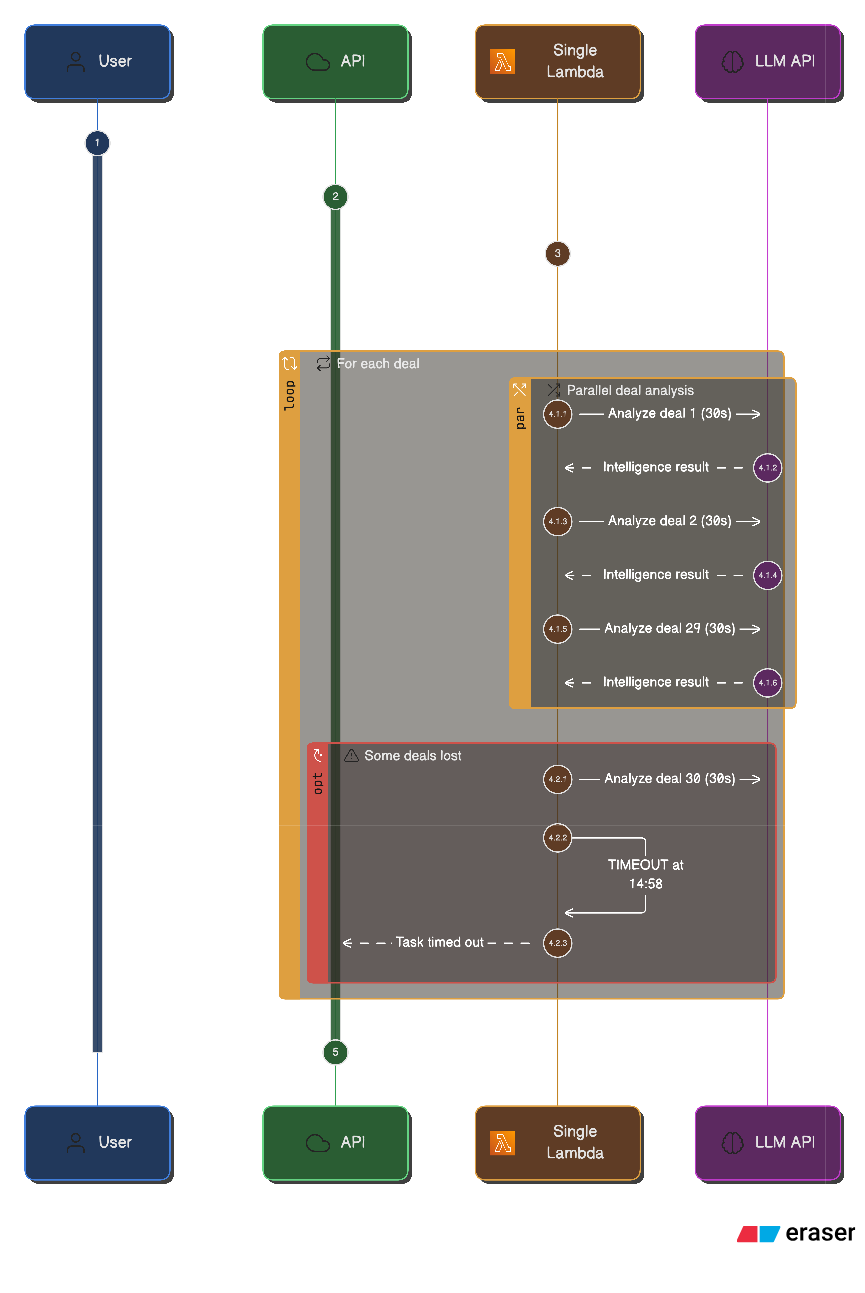
Traditional approach → processes are executed sequentially in a single Lambda.
Here's what that looked like:
Here's what the CloudWatch logs looked like:
[14:52:33] Processing deal 29/127: "Enterprise Renewal - Q4"
[14:52:58] Deal 29 analysis complete
[14:52:58] Processing deal 30/127: "New Logo - Manufacturing"
[14:58:00] Task timed out after 900.00 seconds
At 14:58, the function hits Lambda's 15-minute timeout and is forcibly terminated. Only 29 of the 127 deals are processed. The remaining 98 are lost … no checkpoint, no resume mechanism.
From the user's perspective, the job simply ends with a generic "Task failed" message, with no indication that the failure was caused by a timeout or how much work actually completed.
Let's take a closer look at the original architecture and why it struggled under load.
Sequential Processing
Here's what the broken architecture looked like:
🤔 What's the main problem?
One Lambda, one deal at a time, 15-minute limit. 29 deals processed … and 98 lost. No checkpoint mechanism was implemented, so all the progress was lost!
After analyzing the existing architecture, the next step was obvious: we had to change it. The real question wasn't whether the system needed improvement, but how to make it reliable at scale.
Solving that meant working through a series of concrete architectural choices. In total, we had to make seven key decisions, each addressing a different failure mode in the pipeline.
Let's walk through them one by one in the sections that follow.
Decision 1 - The Orchestrator Problem
The first architectural question was simple but fundamental: who coordinates the workload?
Lambda can't orchestrate itself. If a Lambda function tries to fan out and invoke dozens of other Lambdas, it's still constrained by the same 15-minute timeout.
Eventually, the orchestrator times out before the work completes. You need a component that can wait.
The obvious first candidate is Step Functions.
While Step Functions can handle orchestration, they introduce their own trade-offs. They come with limits of their own, and for this use case they're unnecessarily expensive — you pay for every state transition, not for actual compute.
The better fit turned out to be ECS (Elastic Container Service).
ECS runs long-lived Docker containers with no hard execution timeout. That makes it well suited for orchestration. In our case, it was responsible for:
Splitting the workload into batches
Invoking Lambda workers in parallel
Waiting for completion by polling Redis
Collecting partial results
Advancing the pipeline to the next phase
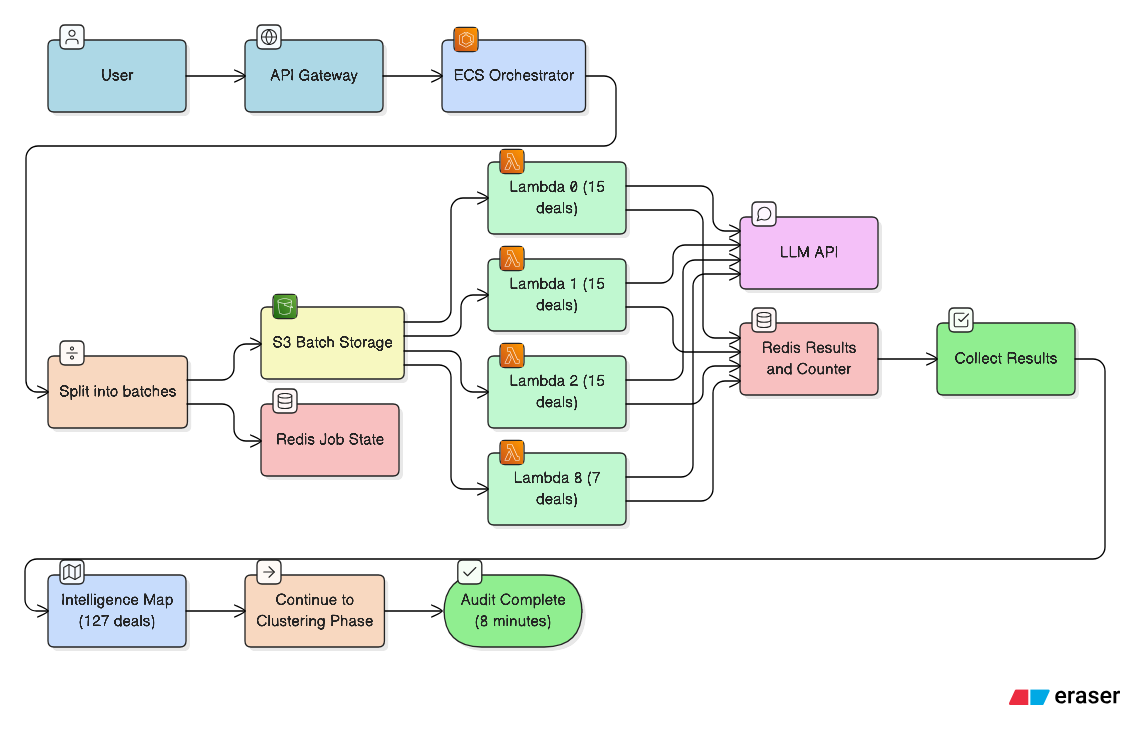
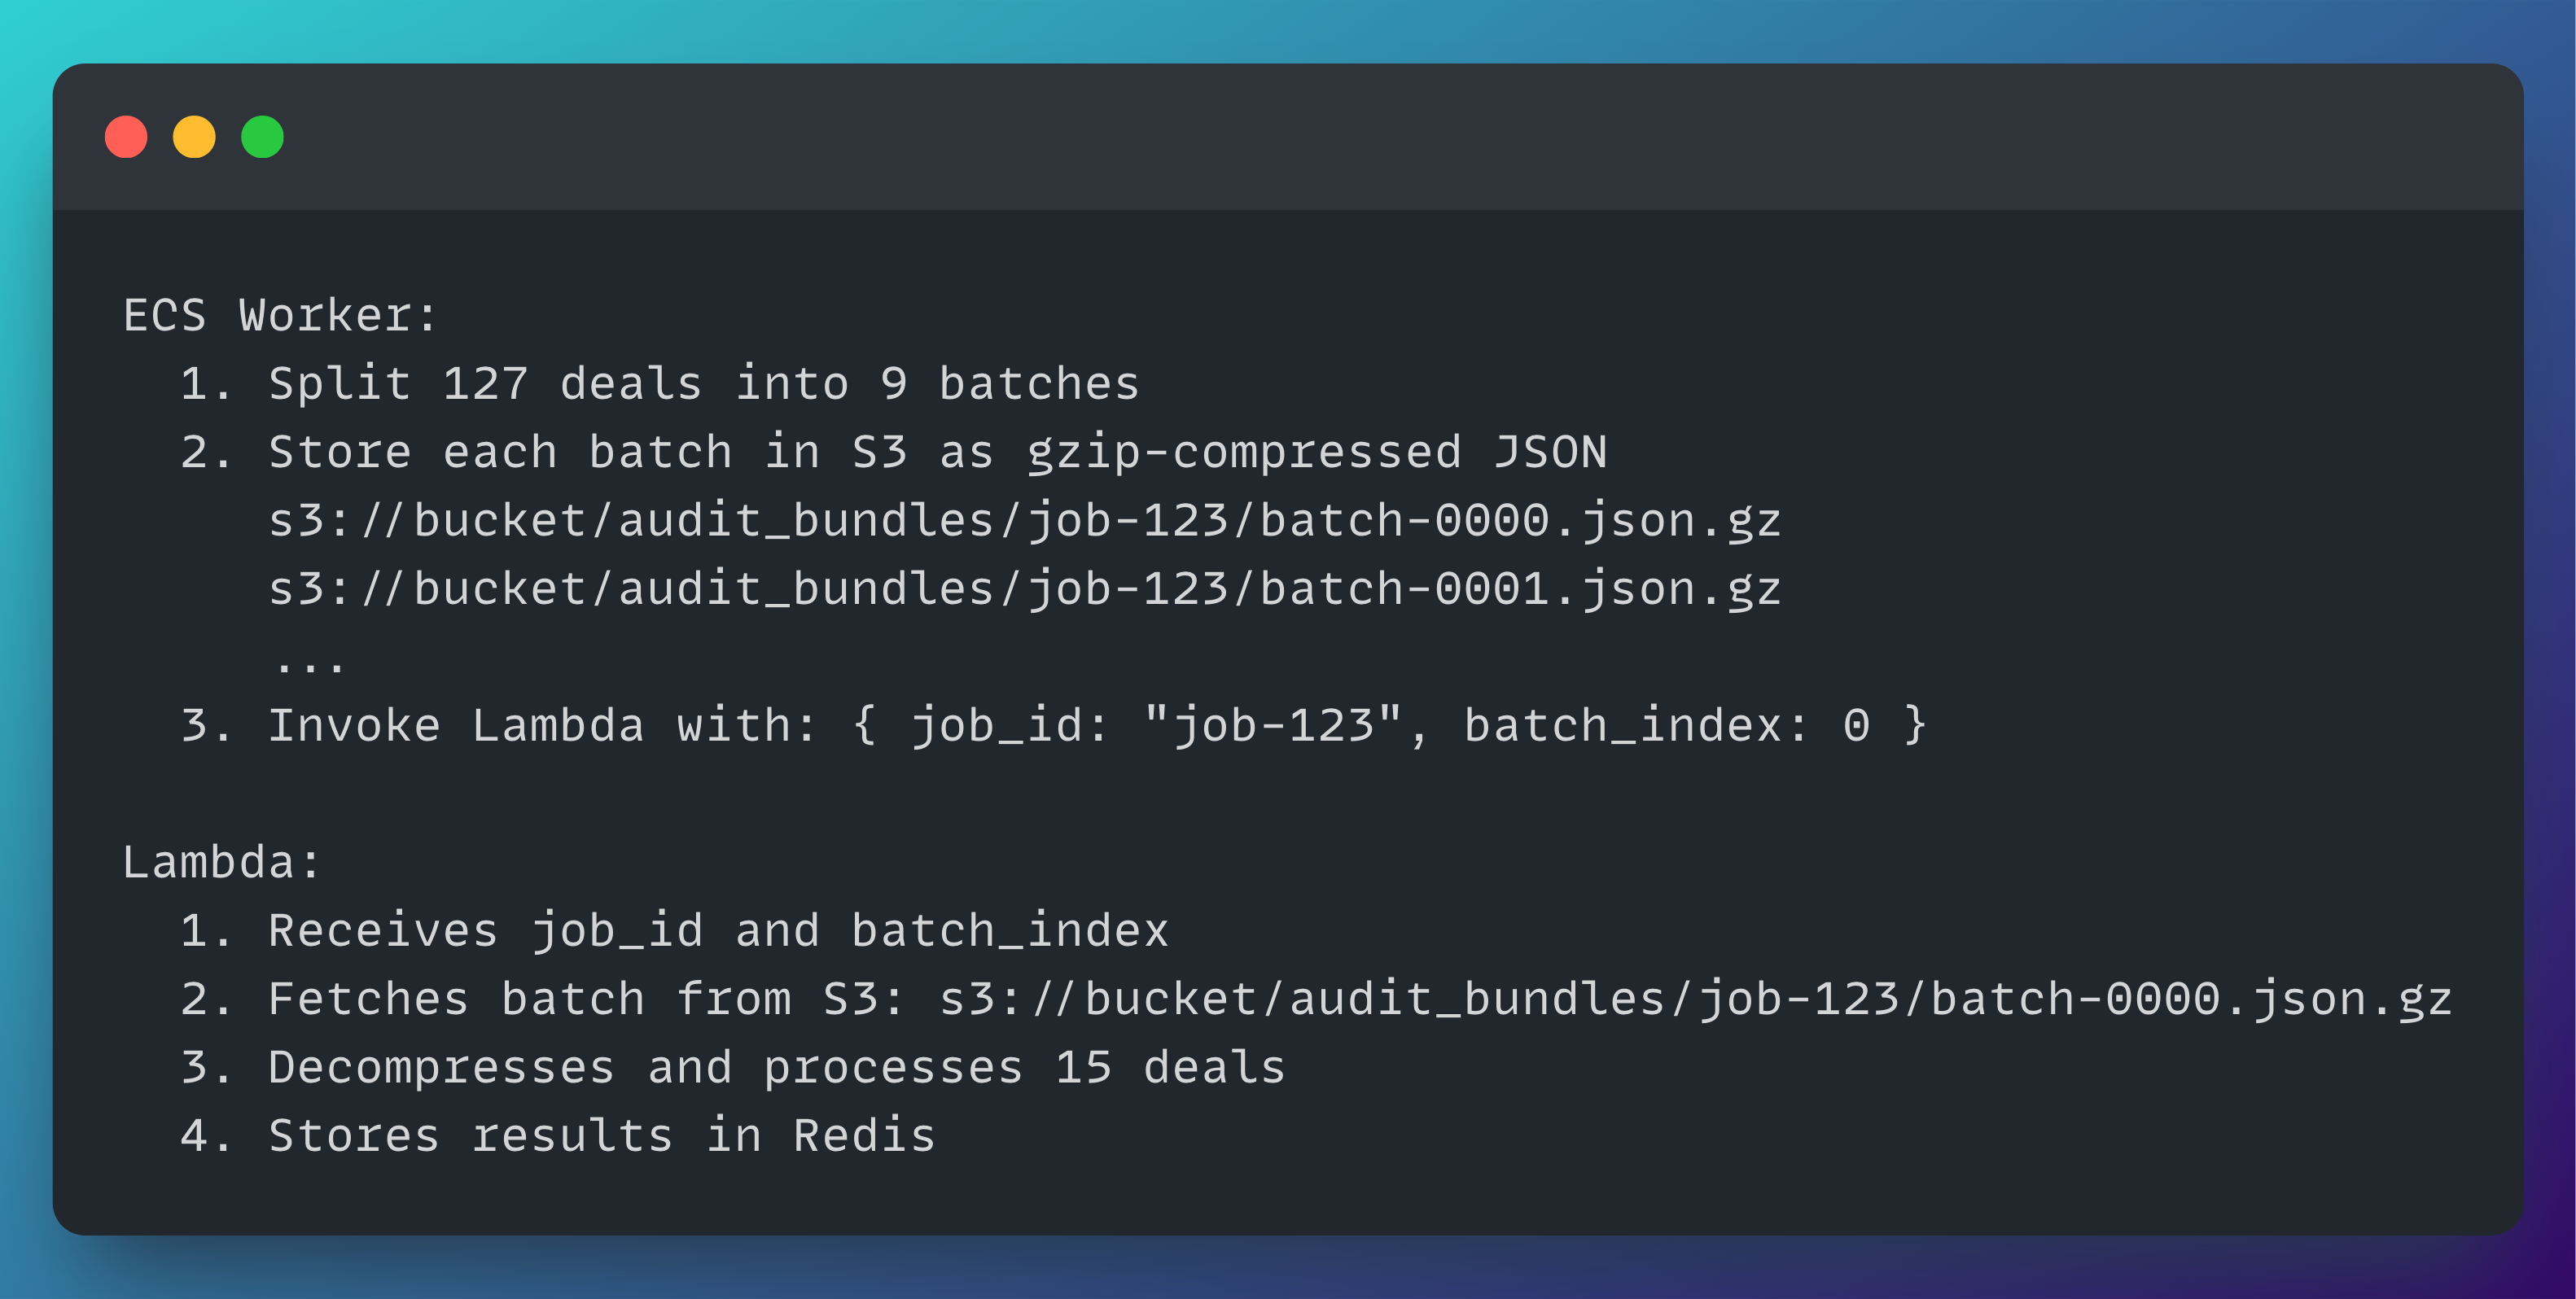
This is where the architecture fundamentally changes. Instead of pushing everything through a single execution path, we adopt a fan-out pattern.
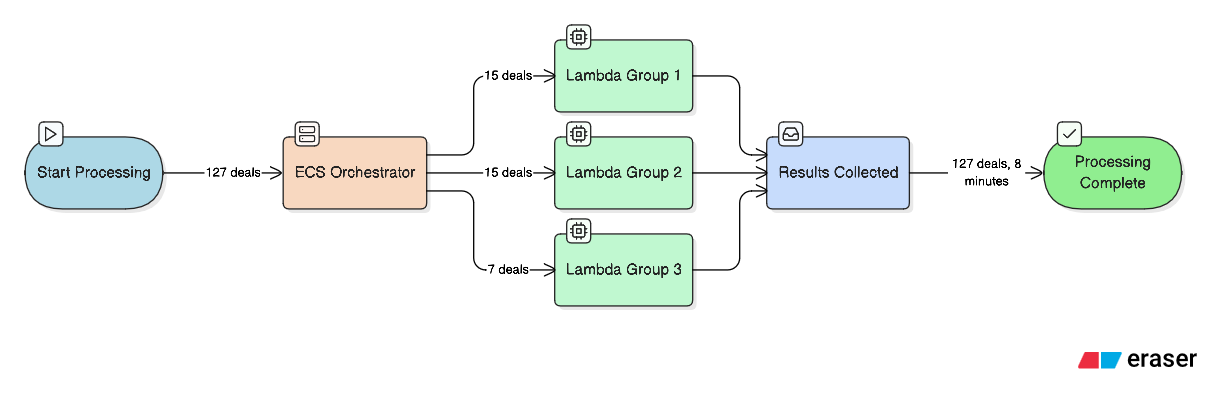
In the fan-out model, ECS acts as the orchestrator, splitting the workload into multiple independent batches and fanning them out to parallel Lambda workers.
Each Lambda processes its assigned batch independently, while ECS remains alive to coordinate progress and handle the next steps.
The result: nine Lambda functions running in parallel, each processing a batch of deals. Every batch completes in roughly seven minutes — well under Lambda's 15-minute limit. All 127 deals are processed successfully, with no timeouts and no lost work.
This naturally raises a few questions.
Why ECS and not just more Lambdas?
Because someone needs to wait. In a fan-out pattern, the orchestrator must remain alive until all workers finish. ECS can poll Redis for 30–40 minutes if needed. Lambda can't — it dies at 15 minutes.
Why not use ECS for everything?
Cost and efficiency. Running nine ECS containers to process deals would be significantly more expensive than invoking nine Lambdas. Lambda is ideal for short-lived, parallel compute. ECS plays the role of the patient coordinator.
This separation of responsibilities is exactly what makes the fan-out pattern work: Lambda handles execution, ECS handles orchestration.
Decision 2 - The Batch Size Problem
How many deals per Lambda batch?
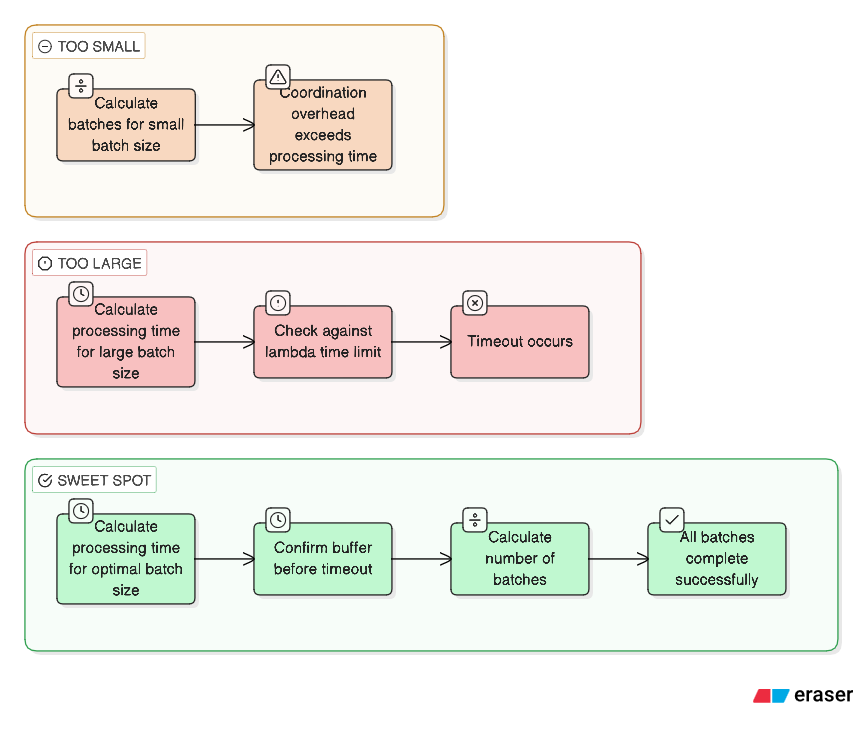
Batch size turned out to be a critical decision.
Too small (5 deals per batch)
127 deals become 26 batches. At that point, orchestration overhead dominates. You spend more time splitting work, invoking functions, and collecting results than doing actual processing.
Too large (50 deals per batch)
50 deals × 30 seconds per deal equals roughly 25 minutes — well beyond Lambda's 15-minute timeout. The batch never finishes.
The sweet spot landed at 15 deals per batch.
Here's how the math works:
15 deals × ~30 seconds ≈ 7.5 minutes per batch
That leaves another 7.5 minutes of buffer before hitting Lambda's timeout
127 deals ÷ 15 ≈ 9 batches (8 full batches and one smaller batch of 7)
In practice, though, not all deals are equal.
Some deals include hundreds of emails, dozens of notes, and multiple call transcripts. Those can take 45–60 seconds each. A batch made up entirely of "heavy" deals can still push a Lambda invocation close to the timeout.
The ideal solution would be dynamic batch sizing based on content volume — but that adds complexity. We started with a fixed size of 15 and monitored performance closely. For this client’s workload, it proved to be a safe and effective choice.
That gives us nine batches. The next question is how to deliver 15 deals worth of data to each Lambda without running into payload limits.
Decision 3 - The Payload Problem
Lambda imposes a strict 6 MB payload limit
Each deal bundle includes:
Deal metadata
All emails (including full bodies)
Notes
Call transcripts
Document metadata
Multiply that by 127 deals and you're looking at roughly 45 MB of data — far beyond what a Lambda invocation can accept.
Our first attempt was to store everything in Qdrant.
We were already using Qdrant for semantic search, and the idea seemed logical at the time:
Qdrant stores vectors and payloads, so why not attach the full deal bundles as payloads alongside their embeddings?
One system, one query, everything in one place.
Here's what we tried:
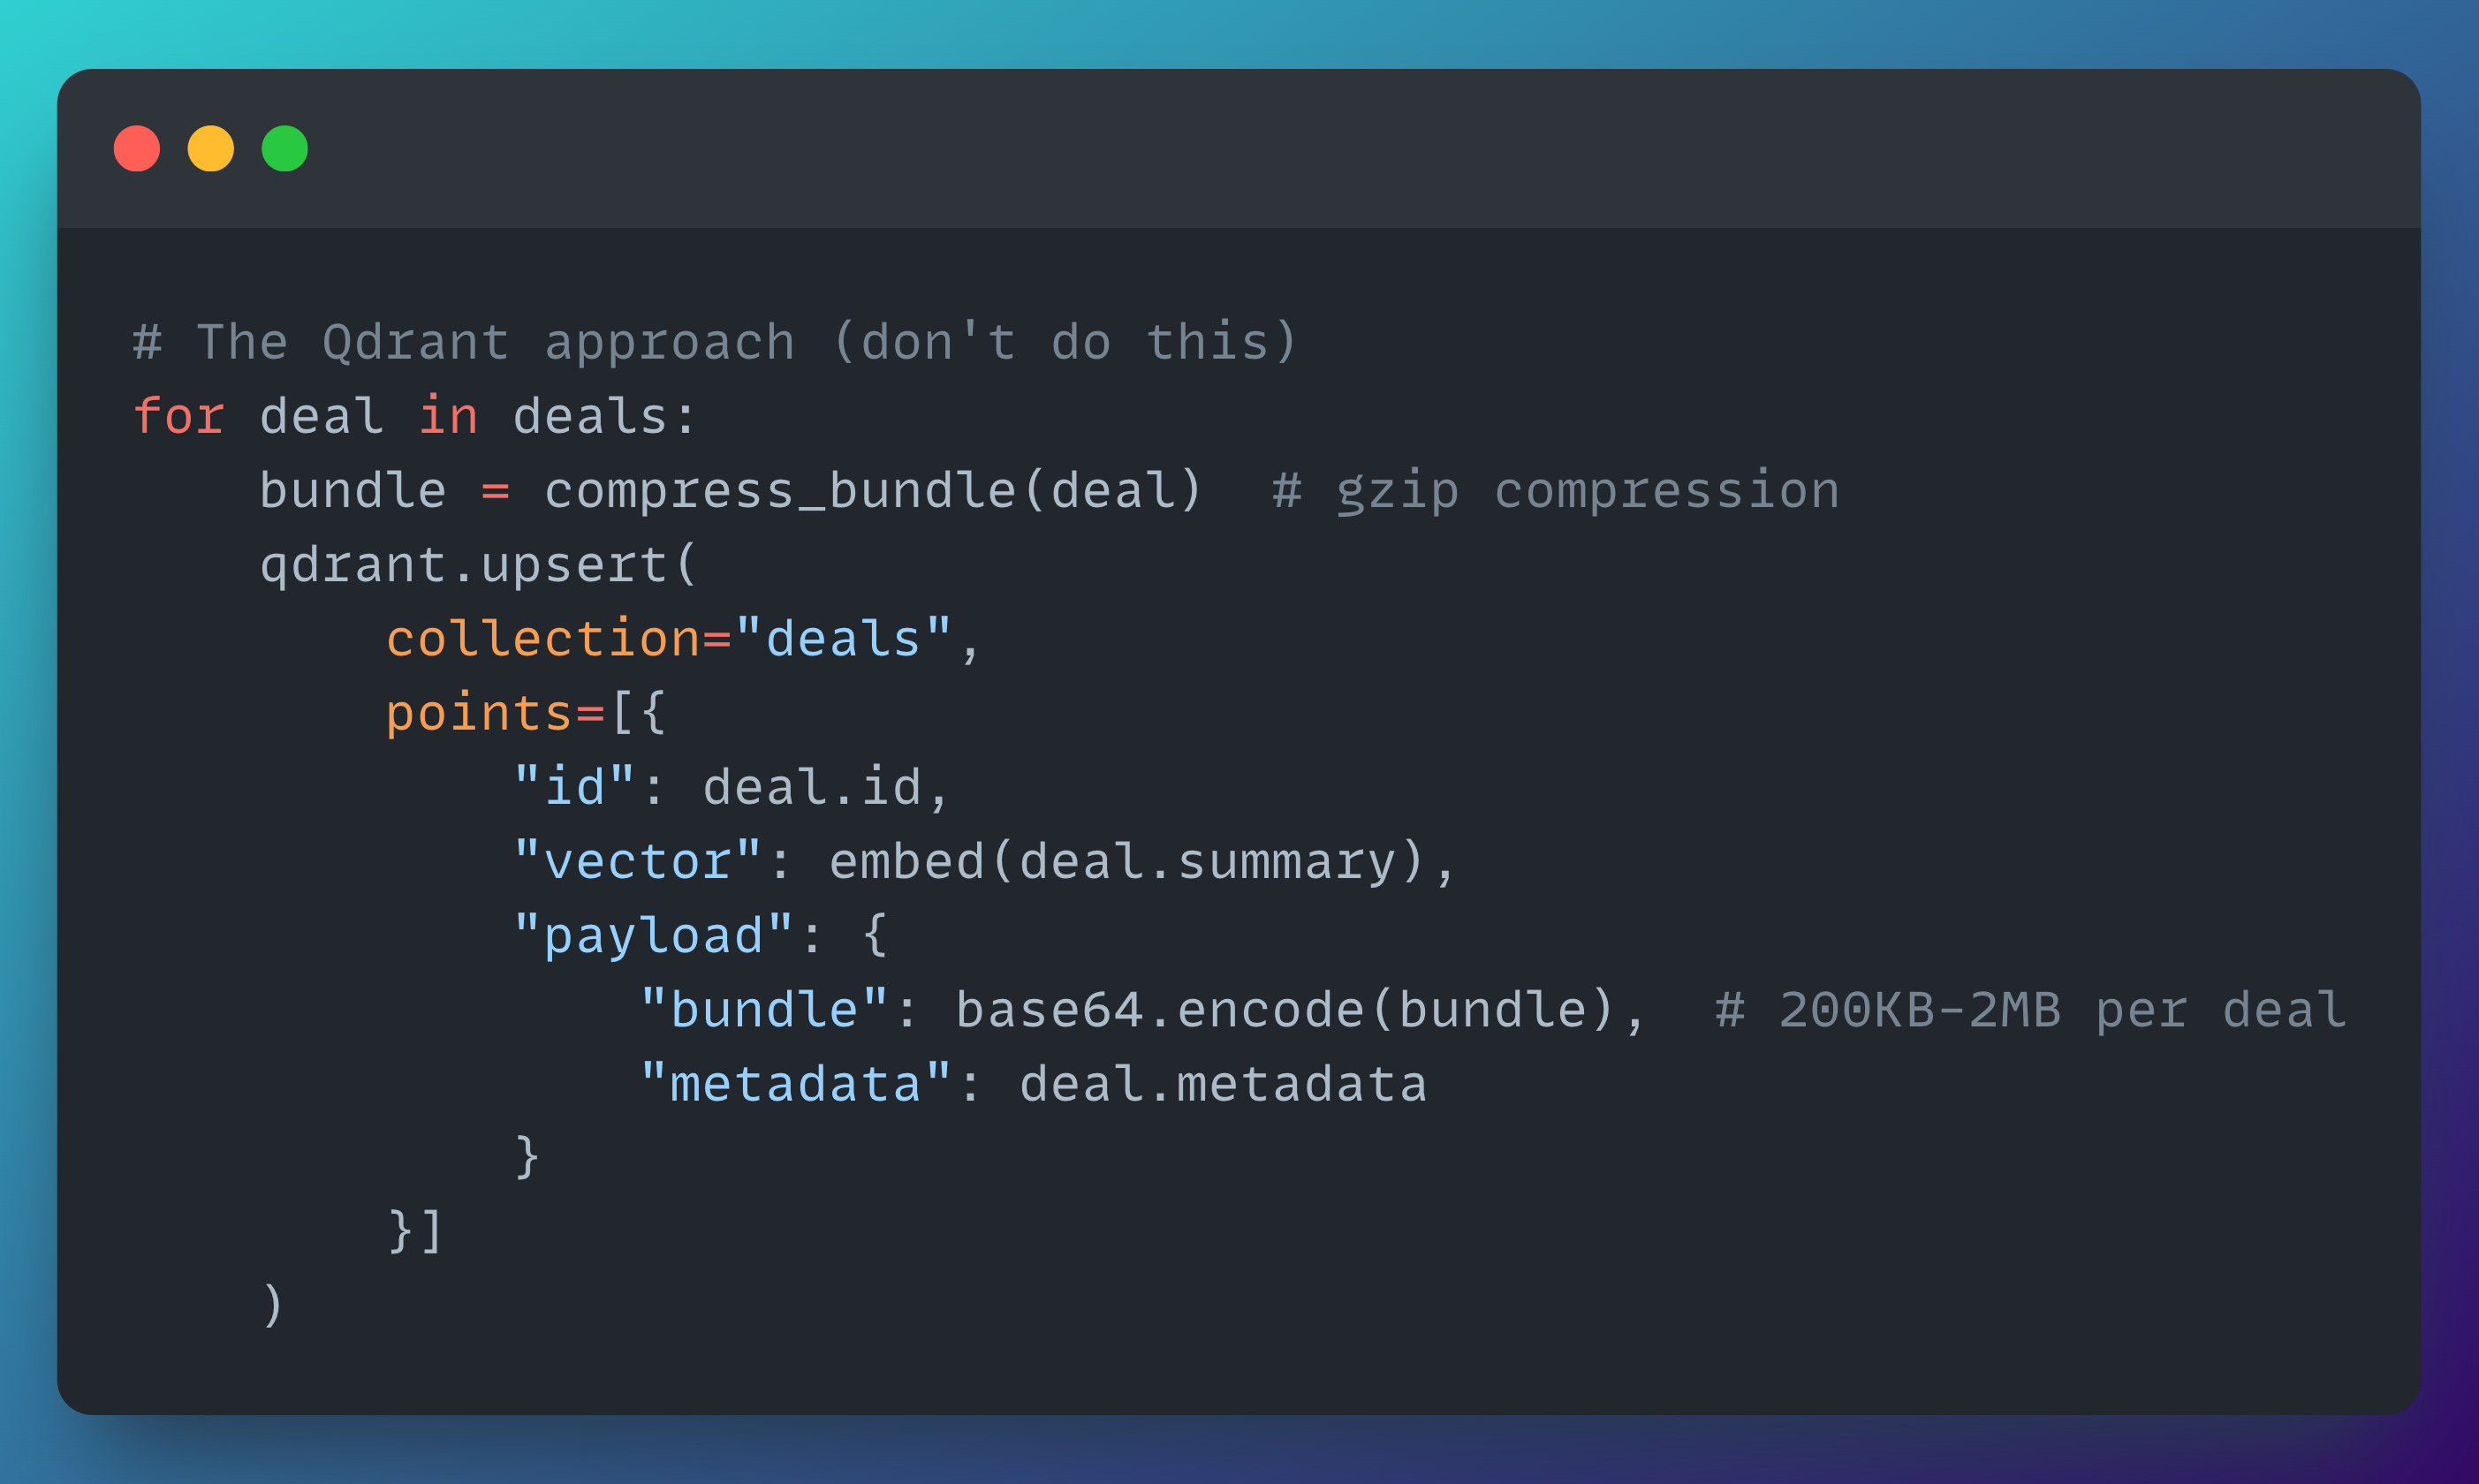
Three problems became apparent almost immediately.
Problem 1 - Qdrant isn't a blob store
Qdrant is optimized for vector similarity search, not for storing and retrieving large binary payloads. We were effectively using a Ferrari to move furniture.
Each upsert with a ~500 KB payload took around 800 ms. Multiplied across 127 deals, the storage phase alone exceeded 100 seconds — before any real processing even began.
Problem 2 - Compression didn't help enough
We tried compressing the deal bundles, but the gains were limited. Email bodies and call transcripts typically compress to 40–60% of their original size. A 1 MB bundle still ends up around 500 KB — far too large for efficient use as a Qdrant payload.
We experimented with multiple approaches:
Gzip: ~50% size reduction, but still 63.5 MB total across all deals
Brotli (level 11): ~15% better compression than gzip, but with a 40% increase in compression time
Brotli level 11 offers the best compression ratio, but it's also the most CPU-intensive. The extra time spent compressing quickly outweighed the marginal size savings.
Problem 3 - Retrieval Was Even Worse
Writing the data was slow …. but reading it back was slower.
When a Lambda needed to process a batch of 15 deals, Qdrant had to deserialize 15 large payloads from its storage engine. A fetch operation that should have taken ~50 ms routinely took 3–4 seconds.
[14:20:15] Storing deal bundles in Qdrant...
[14:21:55] 127 bundles stored (100.3 seconds)
[14:21:55] Invoking Lambda batch 0...
[14:21:58] Batch 0: Fetching 15 bundles from Qdrant (3.2 seconds)
[14:22:01] Batch 0: Starting LLM analysis...
Across nine batches, that added 30+ seconds of pure overhead just to retrieve data we had already stored.
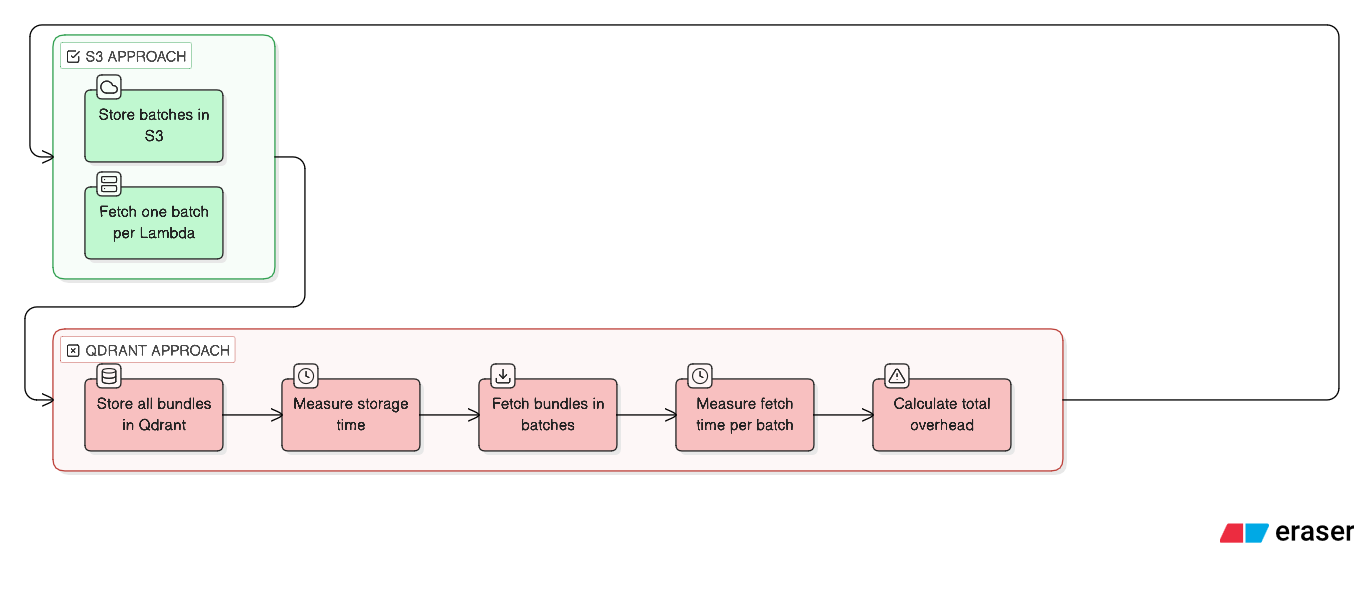
The Solution? Use S3 as the Batch Store
The fix was straightforward: move the batch payloads to S3.
S3 is built for blob storage. It's efficient with large objects, cheap at scale, and fast for the kind of sequential reads we needed. Most importantly, it removes Lambda's payload limit from the equation entirely.
Now each Lambda pulls only the data it needs, when it needs it.
No payload limit issues, no bloated invocations, and no abusing Qdrant as a storage layer. Qdrant goes back to what it's great at: vector search, not bundle transport.
At this point, we had nine Lambdas running in parallel — which introduces the next problem: they won't finish at the same time!
So how do we reliably detect when all batches are complete?
Decision 4 - The Coordination Problem
The first instinct is to poll a database: every 5 seconds, ECS asks, "Are all batches done?".
Sounds reasonable … until you look at how it behaves under real concurrency.
Imagine three Lambdas finishing within the same few milliseconds:
Lambda 0 finishes at 14:23:45.123
Lambda 1 finishes at 14:23:45.127
Lambda 2 finishes at 14:23:45.131
But ECS polls on a fix cadence:
ECS polls at 14:23:45.000 → "3/9 complete"
ECS polls at 14:23:50.000 → "3/9 complete" (missed the updates)
ECS polls at 14:23:55.000 → "6/9 complete" (missed more)
Now you’ve introduced timing gaps where the orchestrator has an outdated view of reality. In the worst case, ECS can believe only 6 batches are done when all 9 have already finished.
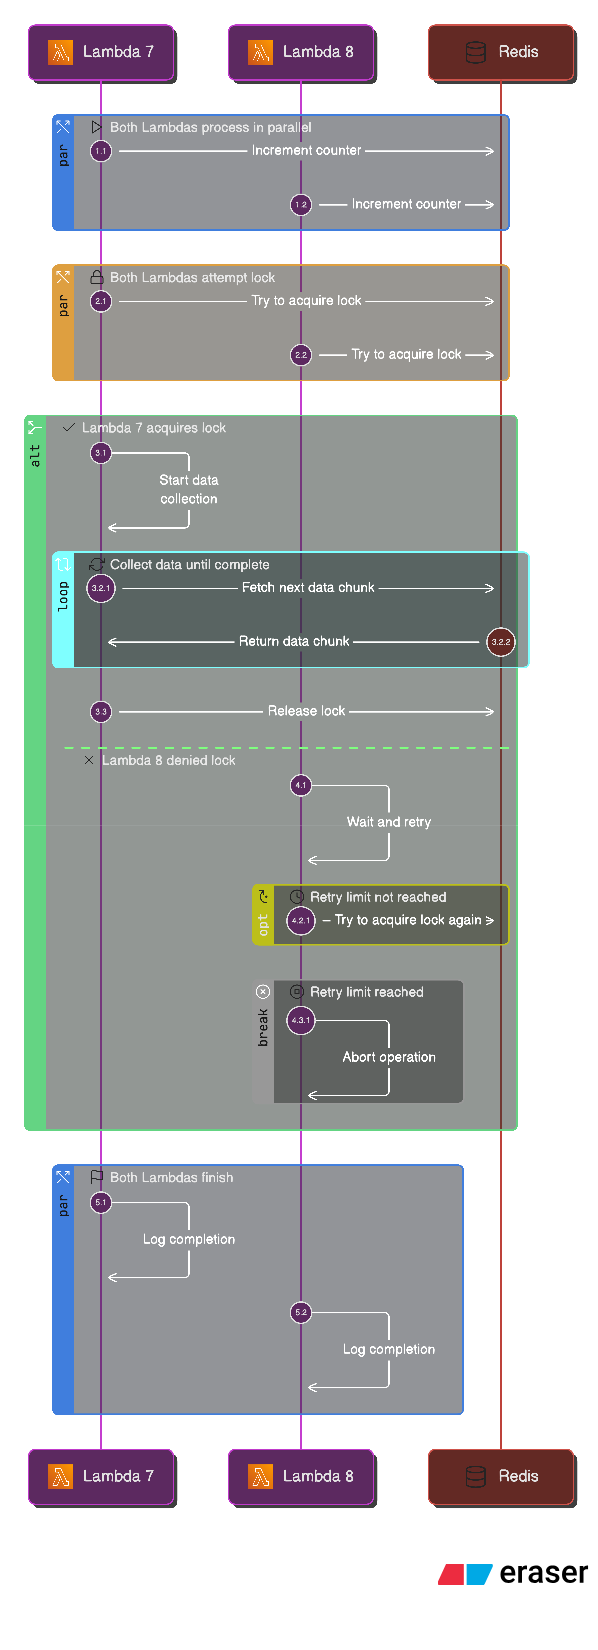
A better approach: Atomic Counters in Redis
Instead of trying to observe completion indirectly, we track it explicitly with atomic operations.
When a Lambda finishes its batch, it does two things:
Push results
Atomically increment a completion counter
If that increment returns total_batches, this Lambda knows it’s the last one. At that point, it attempts to acquire a lock:
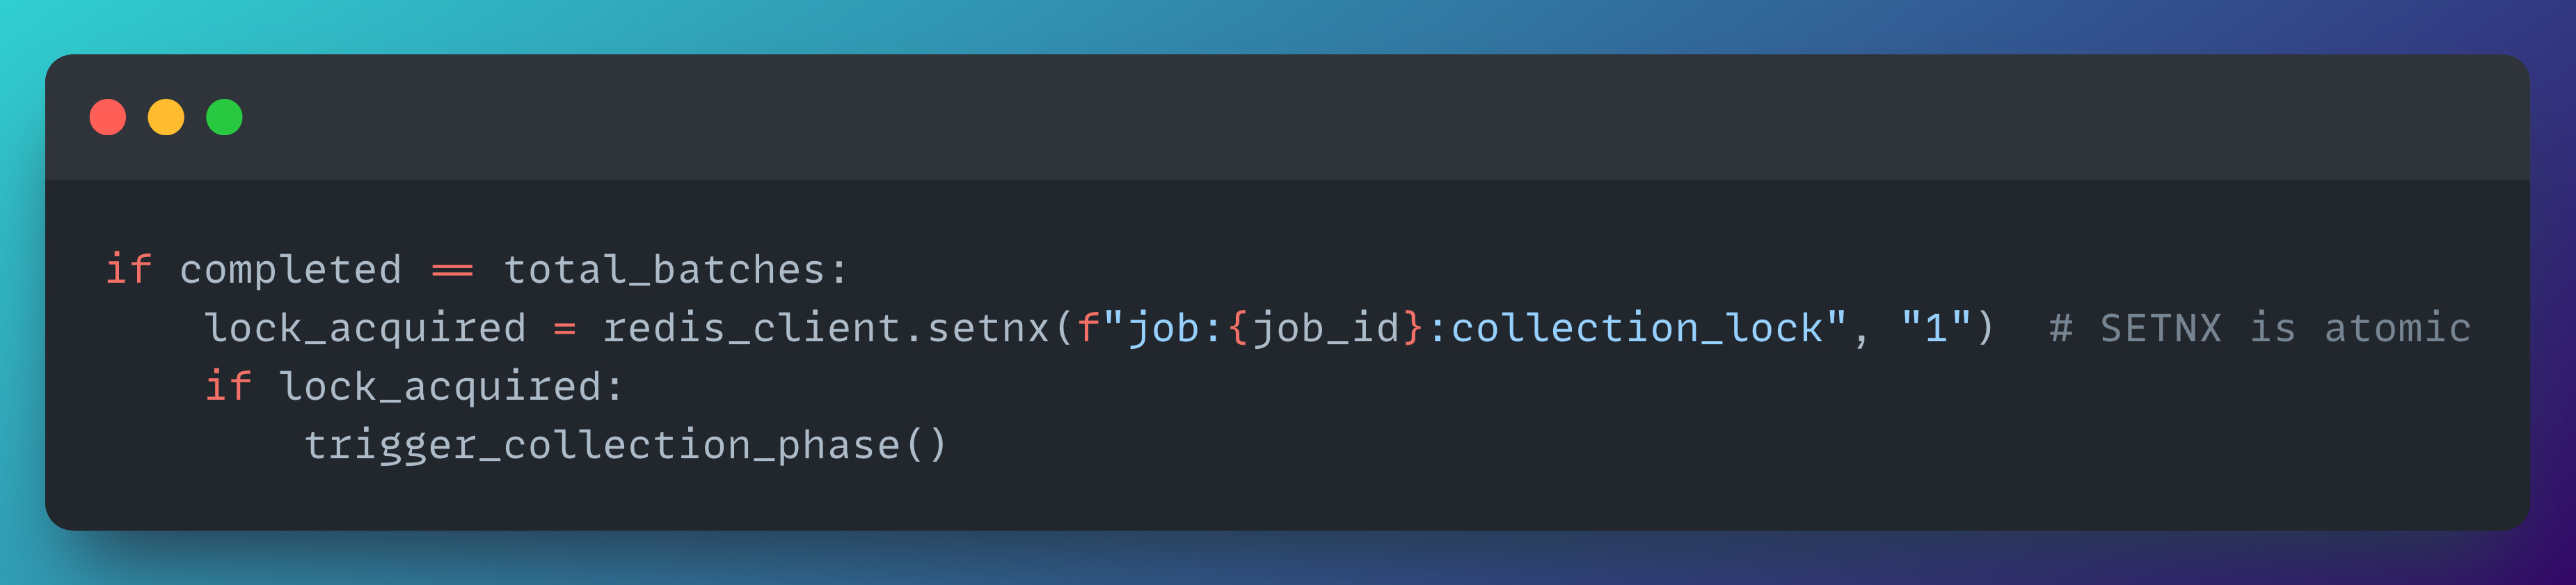
This matters because Lambdas can finish at nearly the same instant. With Redis:
INCR is atomic, so the counter is always correct
SETNX is atomic, so only one Lambda can acquire the “collection lock”
No race conditions, no duplicate collection, no guessing
The Atomic Counter in Action
Mid-job, Redis might look like this:
{
  "audit_intelligence_job:job-123": {
    "job_id": "job-123",
    "total_deals": 127,
    "total_batches": 9,
    "status": "extracting",
    "created_at": "2024-01-15T14:20:00Z"
  },
  "audit_intelligence_job:job-123:completed": 7,
  "audit_intelligence_job:job-123:failed": 0,
  "audit_intelligence_results:job-123": [
    "{\"batch_index\":0,\"deal_id\":\"deal-1\",\"intelligence\":{...}}",
    "{\"batch_index\":0,\"deal_id\":\"deal-2\",\"intelligence\":{...}}",
    ...
  ]
}
The key point: the completion counter (completed: 7) is separate from job metadata, and safe to poll. Once it reaches 9, you know every batch is done — reliably.
Now that we can detect completion, the next question is: what do the results actually look like, and how should they be structured for downstream phases?
Decision 5 - The Result Structure Problem
Once the fan-out is running, the next question is unavoidable: what does a Lambda actually produce, and what does the final, aggregated output look like?
In our case, each Lambda processes a batch and writes its results to Redis. The unit of output is one JSON object per deal, containing both the extracted intelligence and a lightweight summary of the underlying content.
Here's what a single deal result looks like:
{
  "deal_id": "deal-12345",
  "deal_name": "Enterprise Renewal - Q4",
  "success": true,
  "intelligence": {
    "qualification_score": 72,
    "qualification_gaps": [
      "Timeline unclear - no close date discussed",
      "Budget not confirmed"
    ],
    "risk_level": "medium",
    "risk_signals": [
      "Single threaded - only sales rep contact",
      "Gone silent - no activity in 12 days"
    ],
    "pain_points_identified": [
      "Current system lacks real-time reporting",
      "Manual data entry causing errors"
    ],
    "objections_raised": [
      "Concerned about implementation timeline",
      "Wants to see ROI before committing"
    ],
    "competitors_mentioned": ["CompetitorA", "CompetitorB"],
    "buying_signals": [
      "Requested pricing breakdown",
      "Looped in VP of Engineering"
    ],
    "champion_strength": "moderate",
    "engagement_quality": "good",
    "decision_maker_engaged": true,
    "close_probability": 65,
    "days_to_close_estimate": 45,
    "deal_health_summary": "Deal shows moderate qualification with some risk signals. Champion is engaged but timeline and budget need clarification. Competitor mentions suggest active evaluation.",
    "recommended_next_action": "Schedule call with VP Engineering to clarify timeline and budget constraints",
    "recommended_intervention": null,
    "confidence_level": "high"
  },
  "content_summary": {
    "email_count": 47,
    "note_count": 12,
    "call_count": 8,
    "meeting_count": 3,
    "document_count": 5,
    "total_content_chars": 125000,
    "has_meaningful_content": true
  }
}
That's a single deal. A batch of 15 deals produces 15 records like this. Across 9 batches, we end up with 127 total outputs.
Once all batches are complete, ECS reads the results from Redis and builds a canonical structure — an intelligence map keyed by deal ID:
intelligence_map = {
    "deal-12345": DealIntelligence(...),
    "deal-12346": DealIntelligence(...),
    ...
    # 127 deals total
}
This aggregated view becomes the input for downstream steps like smart clustering (group deals with similar risk patterns) and prioritization (surface high-quality, high-intent deals first).
So far, so good — but this design introduces the next reliability question:
What happens when a batch fails?
Decision 6 - The Failure Handling Problem
Now assume batch 3 fails. That's 15 deals in limbo. What should happen next?
The naive response is to fail the entire job. But that's the worst outcome: you might have already processed 112 deals successfully, and you'd be throwing away all that work because one batch didn't make it.
A better approach is to treat failures as first-class state: track them explicitly and continue with partial results.
Here's what Redis might look like after batch 3 fails:
{
  "audit_intelligence_job:job-123:completed": 8,
  "audit_intelligence_job:job-123:failed": 1,
  "audit_intelligence_job:job-123": {
    "errors": [
      "Batch 3 failed: Lambda timeout after processing 12/15 deals"
    ]
  }
}
In this model, the job still completes — just with a degraded result set. For example:
115/127 deals extracted successfully
The clustering phase continues using whatever intelligence is available
The user gets a clear warning, e.g. "115/127 deals analyzed successfully. 12 deals failed due to timeout."
This is a big step up from "Task failed" because it preserves value and makes the system predictable under failure.
One more thing we learned: not every failure is permanent. A timeout might happen because the LLM API was slow, not because the batch was fundamentally too large. In many cases, simply retrying the failed batch would succeed.
The natural next improvement is automatic retries for failed batches (with limits, backoff, and good visibility). We didn't implement that immediately — but we designed the system so it could be added cleanly.
Which brings us to the orchestrator itself: even if we handle worker failures gracefully, how long should ECS wait before it decides the job is truly stuck?
Decision 7 - Orchestrator Timeout Strategy
At this point, the final question is: how long should ECS wait before giving up on a job?
The naive solution is a fixed timeout — for example, "wait 30 minutes, then fail."
That works only in trivial cases.
In practice, job duration scales with workload size. A pipeline with 127 deals might finish in 8 minutes. One with 500 deals might legitimately need 25 minutes. A fixed timeout either wastes time (waiting far too long for small jobs) or fails early (cutting off large jobs that would have completed).
A better approach is a dynamic timeout that scales with the number of items being processed.
Here's a simplified version of what we used:
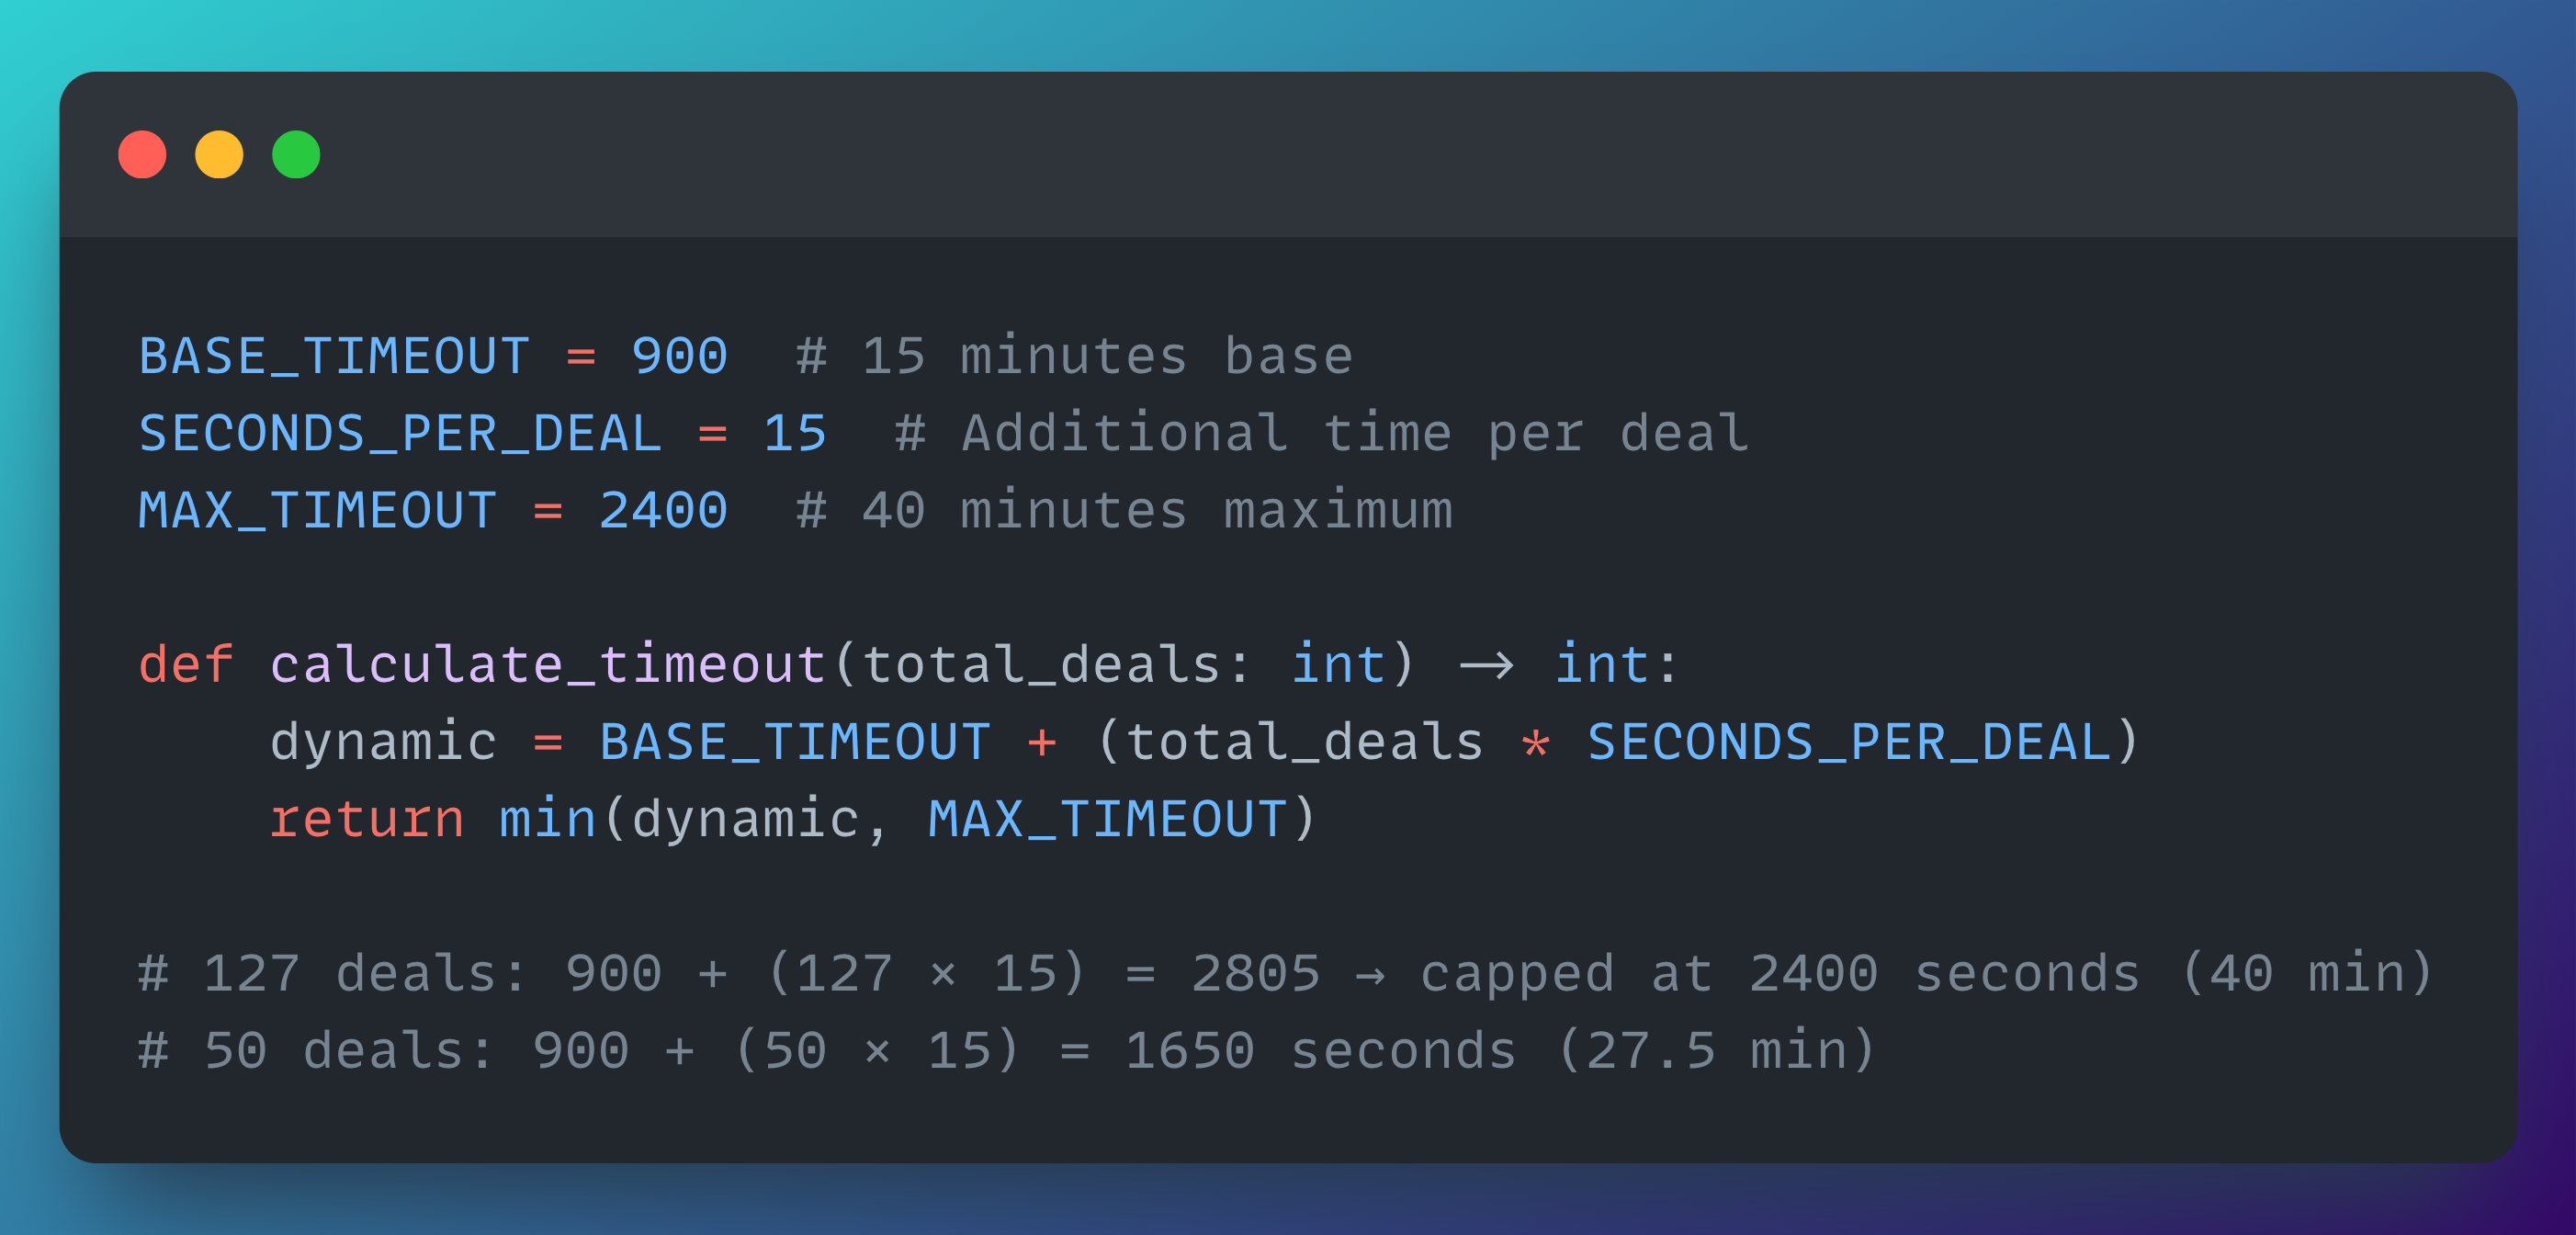
With this model:
127 deals → 900 + (127 × 15) = 2805 seconds → capped at 2400 seconds (40 min)
50 deals → 900 + (50 × 15) = 1650 seconds (27.5 min)
This gives larger jobs the time they need to finish, while ensuring smaller jobs don't sit around unnecessarily — and the orchestrator never waits indefinitely.
At this point, all the major failure modes are accounted for, and the system can scale predictably with workload size.
The Complete Architecture
Now that we've walked through each decision, here's the full system:
We started with a familiar failure mode: 127 deals, an estimated 63.5 minutes of processing, and Lambda's hard 15-minute timeout. The job was terminated at 14:58, after only 29 deals had been processed.
Here's where we ended up:
ECS orchestrator — no execution time limit, responsible for coordinating the entire workflow
Lambda workers — 9 batches running in parallel, each processing 15 deals in ~7 minutes
S3 batch storage — eliminates Lambda’s 6 MB payload limit and replaces the failed Qdrant approach
Redis coordination — atomic counters for reliable completion tracking with no race conditions
Graceful failure handling — partial results are preserved and failures are explicitly tracked
Dynamic timeouts — orchestrator wait time scales with workload size
The outcome: 127 deals processed in 8 minutes instead of 63.5. No timeouts. No lost progress.
Hey! It's Miguel again! 👋
Before I go, just a quick update! Antonio Zarauz Moreno and I are kicking off our Finetuning Sessions next week!
The first session (Lesson 0) will cover the course structure, the tech stack we'll be using, the different content formats, and what cadence you can expect going forward.
Make sure to become a paid subscriber to get the most out of this course!
See you next Wednesday 👋
 | A guest post by
|
Insightful!